|
When using the SUM function, most people set up totals at the bottom of spreadsheets:
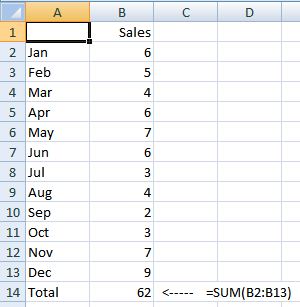
This is fine when there are a fixed number of rows, such as 12 months in a year.
However, when dealing with varying number of values, such as expenses, the layout has problems:
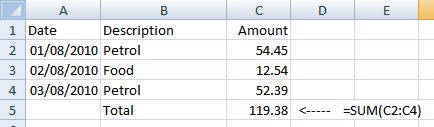
To add a new expense, I need to insert a row, add my new expenses, and then check if my SUM formula covers the new data.
It’s much easier to set out such a spreadsheet with the totals at the top:
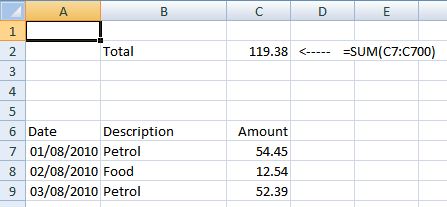
Now, I can just keep adding expenses and the formula in cell C2 will keep on recalculating. Just make sure that you use a large enough area (700 rows should be fine!) and you don’t put anything else underneath the expense list.
<-Previous (R)  Next (T)-> Next (T)->
|